
In the laboratory indicators module, we have the endorsment of SBPC/ML – Brazilian Society of Clinical Pathology/Laboratory Medicine, Controllab partner since 1977.

Promotes information for more assertive decisions. The platform improves processes, enhances performance, identifies new opportunities and keeps the organization sustainable.
The information generated by the program encourages decision makers to gain a broader view of the results achieved for the process improvement and laboratory sustainability.

With Metricare, the laboratory identifies whether the efforts and strategies applied in the processes are competitive with their equals, based on hard evidence. This evidence helps to reduce costs, increase efficiency and productivity.
This is because the program uses benchmarked indicators to measure and compare laboratory performance against market performance.
The indicators contemplated in the laboratory module are correlated in all areas, providing a global and systemic view of the process.
A multidisciplinary team (including statistics) reviews data reported in the program of Metricare, that acts as a third party company, imparting impartiality and confidentiality to reported data.
Metricare follows a code of ethical conduct & compliance integrated with national and international laws for general data protection. The platform has a detailed manual and description for the reliability and standardization of information.
There are more than 150 indicators available for the laboratory.
To simplify data collection and improve access to information, partner companies integrate the LISto the Metricare, promovendo mais agilidade nos processos e confiabilidade nas informações disponibilizadas em tempo real para a tomada de decisão.

Traceability in Metricare favors transparency for accreditations such as ISO 15189, CAP, PALC, DICQ and others, which require the demonstration of objective evidence that supports and assists the planning, monitoring and evaluation of process performance.
In the platform, the laboratory has a chance to compare with its equals and see if the actions taken over time are significant in relation to the market.
By participating, the laboratory improves the monitoring of indicators and there is greater effectiveness in management, increasing the level of safety for managers, health professionals and patients.
SBPC/ML e Controllab, are collaborating entities in the QUALISS – Qualification Program of Health Service Providers of ANS – National Agency of Supplementary Health.
Broad and comprehensive
indicator scope
Internationally harmonized indicators aligned with IFCC
Goal setting to achieve determined goals
Group of experts involved in monitoring the program
Comparison between networks
(support or brands)
Integration with LIS providers to simplify data collection
Some numbers prove the heterogeneity between laboratories, contributing to a robust benchmarking program.
+350
17

n times of crisis management, such as the one caused by the Covid-19 pandemic, Metricare becomes an ally to managers.
In order to maintain reliable processes, avoid impacts on the quality of the results and protect the reputation of the institutions, the data obtained in the PBIL were fundamental to guide the managers’ decision.
Having the measurement and knowledge of the weaknesses and strengths of the laboratory, were determining factors for agile decisions, amid scenarios of uncertainty.

Monthly, laboratories receive benchmarking from data reported or obtained directly from the Laboratory Information System (LIS). Upon registration, the laboratory receives a password to access Metricare.
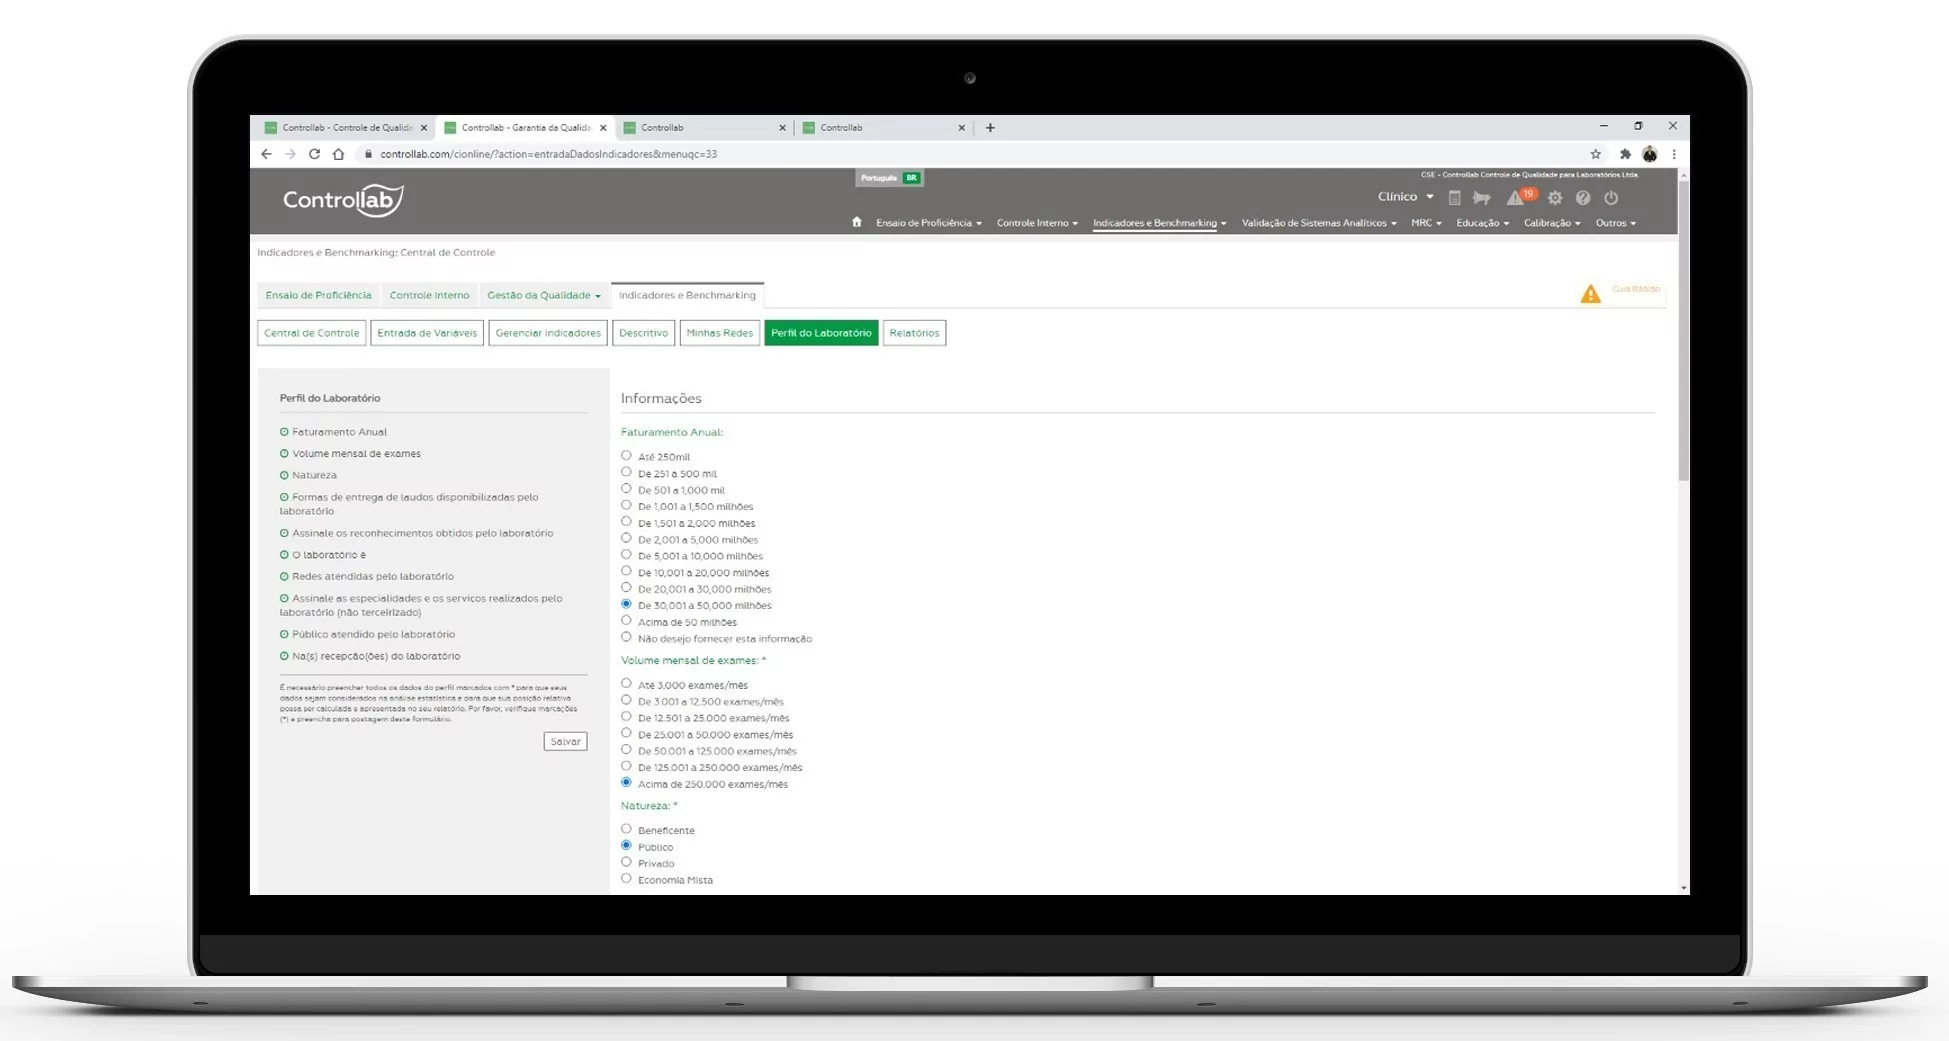
The laboratory fills in the information that will compose its comparison profile (exam amount, target audience, nature, and other information that help it compare it with other organizations with similar characteristics).
Controllab’s statistical team uses laboratory profile information to recommend the best comparison group for their characteristics. The laboratories are compared among their equals. The laboratories are compared among their equals.
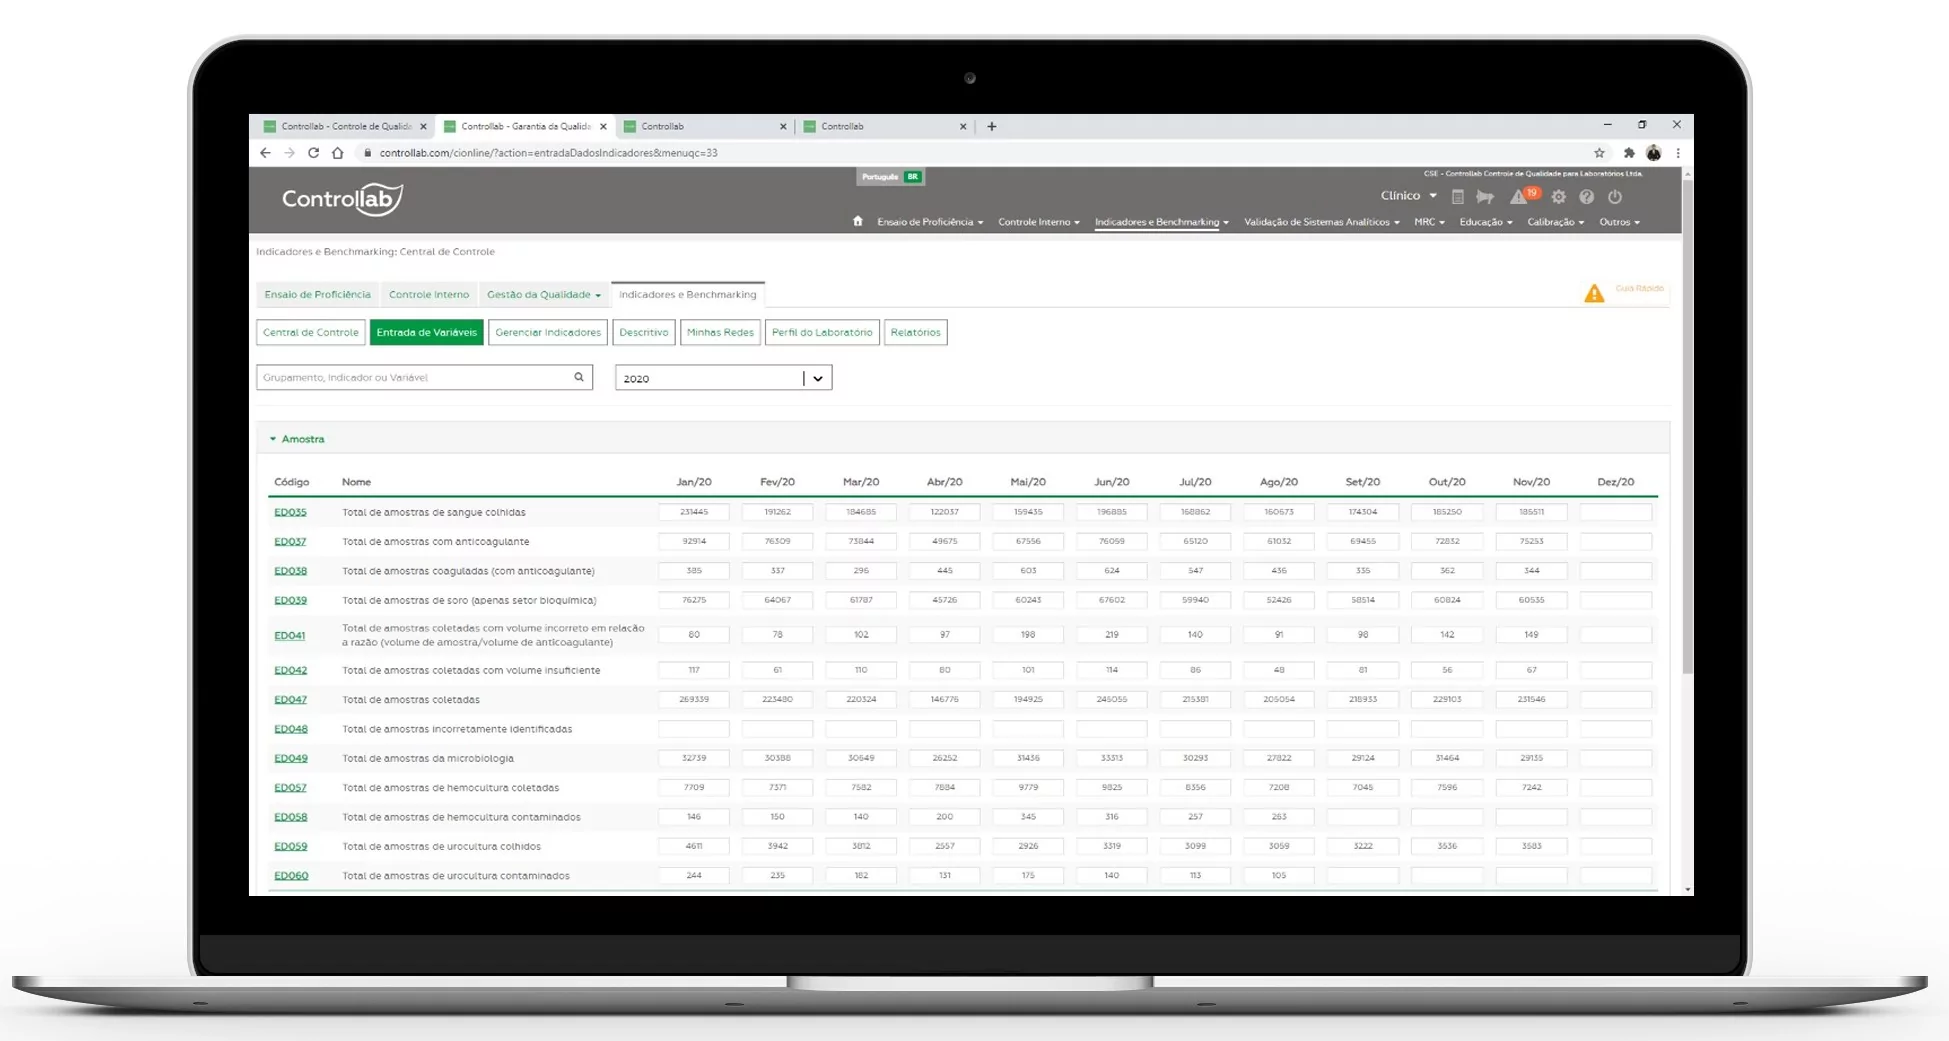
Data reporting is ongoing and available for immediate access to information retrieval. They can be sent manually or via integration / interfacing with the laboratory’s LIS.
When data is sent via integration / interfacing, the program automatically collects laboratory data and directly transmits the LIS information to the Controllab system.
Integration provides more convenience for the routine, reducing the complexity of data collection and improving access to information. It promotes more process agility and data reliability. Allows real-time access to information for decision-making.
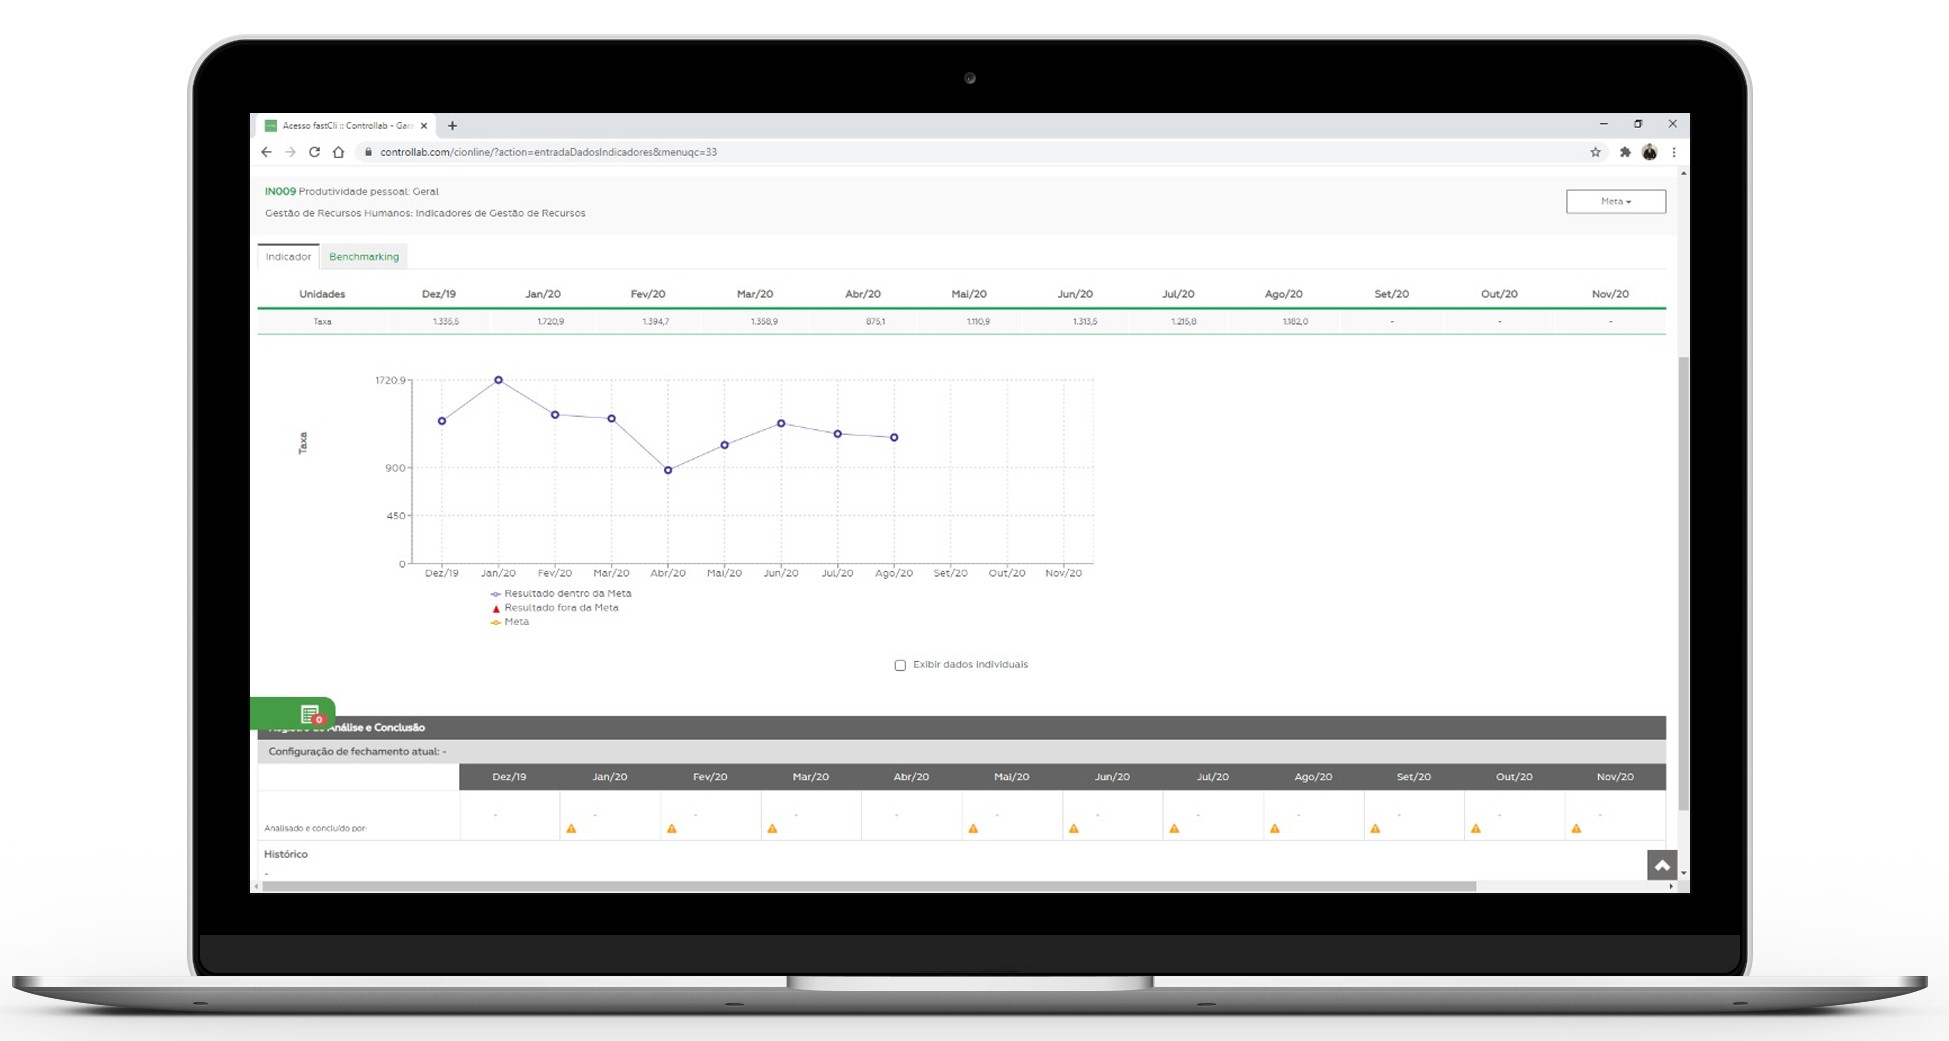
The follow-up graph is automatically generated from the monthly reported data and allows to check the behavior of the results over the periods.
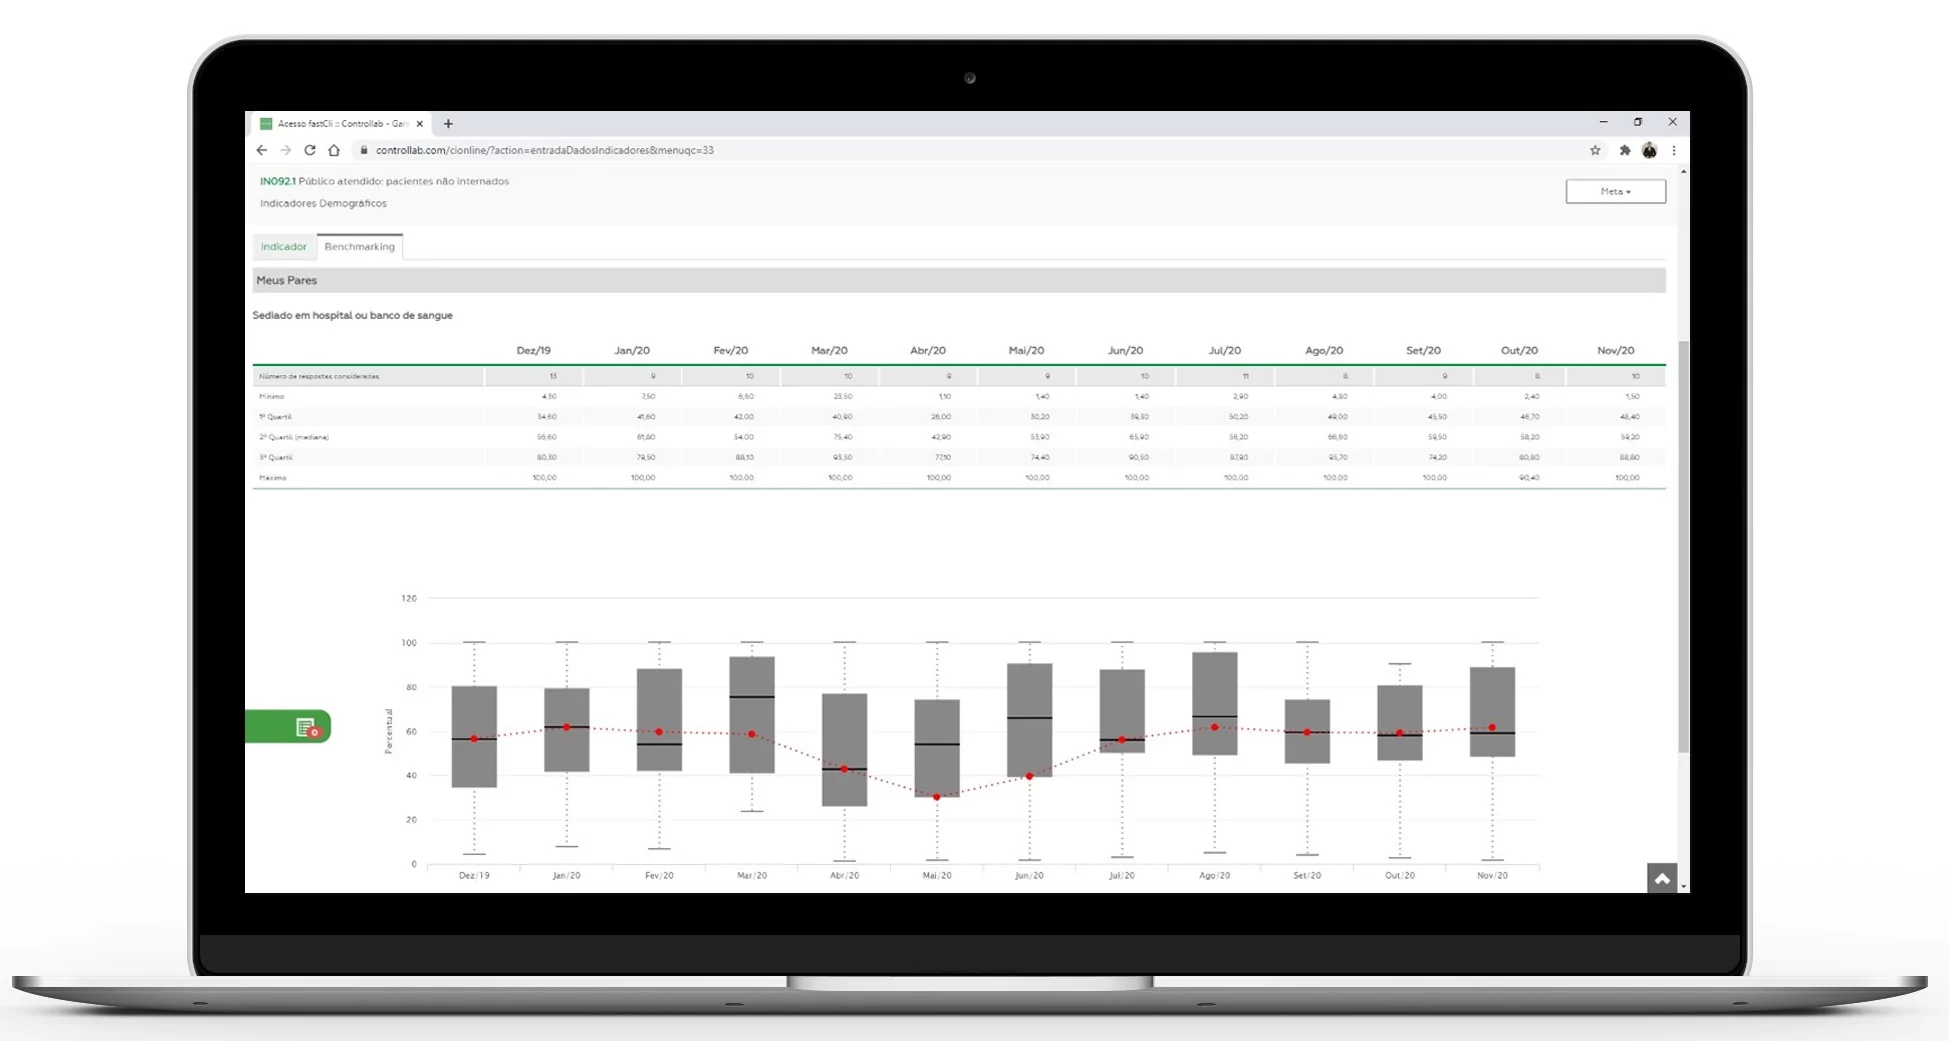
Monthly the laboratory visualizes in real time the market comparison of its results to define the priority actions to the organization’s strategies.
The positioning of the laboratory in the market is indicated in the box plot graph. The Box plot is adopted for the graphical representation of the data because it allows an excellent visualization of the dispersion, symmetry, outlier barriers and outliers, regardless of the way the data is distributed. The Box plot is based on the median and quartiles, which reduces the impact of outliers and allows an excellent exploratory analysis.
See how to interpret the result in the Box plot graph.
Relative Equal Ranking and Sigma Metrics are applied to the results, where relevant, to encourage continuous improvement of laboratory processes.
Results in Sigma Metrics: Indicates Process Quality
Ranking: 1st are the best results and 5th the most sensitive results
LIS developers integrate laboratory systems with Metricare to reduce data collection complexity and improve access to information, promoting faster process processes and reliability of real-time decision-making information.
it lets you focus on benchmarking results analysis
data
reliability
reduce data collection failures
time in raw data monitoring
Some developer companies, in addition to integrating LIS, promote the indicators in their systems to contribute to laboratory sustainability.

E Essential Indicator